for a more updated version, check https://jeqo.github.io/posts/2019-03-26-importance-of-distributed-tracing-for-apache-kafka-based-applications/
Tracing is one of the hardest time in integration or microservice development: knowing how a request impact your different components, and if your components have behave as expected.
This could be fairly easy if we have monolith where we have one database and with some queries or checking one log file you can validate everything went well.
Once you introduce distributed components and asynchronous communication this starts to get more complex and tedious.
OpenTracing (http://opentracing.io/) offers a way to solve this bringing a
vendor neutral API to be able to create spans that represent the meaningful
tasks that form part of a trace.
Use-Case
In this post we will see how to instrument Java applications that communicates using Apache Kafka as Event Log, and how visualize traces and analyze latency.
The scenario will be a simple Hello World Producer/Consumer. The producer side will send a “greeting” event to “greetings-topic”, and the consumer side will poll events and print out to console.
Technologies
-
Dropwizard: Framework to run Web Services.
-
Apache Kafka: Event Log.
-
OpenTracing and Jaeger: API and instrumentation for distributed tracing.
Implementation
Let’s assume we have a simple application that produce greetings events
and another application that consumes and print those events.
To execute this applications let’s first start a local version of Kafka:
Install and Run Kafka
First, execute the script to install Kafka:
cd kafka/
./install-kafka.sh
Once it is installed, start Zookeeper and then one Kafka broker:
./start-zookeeper.sh
...
[2017-09-27 22:09:26,634] INFO binding to port 0.0.0.0/0.0.0.0:2181 (org.apache.zookeeper.server.NIOServerCnxnFactory)
...
./start-broker.sh
...
[2017-09-27 22:09:33,814] INFO Registered broker 0 at path /brokers/ids/0 with addresses: EndPoint(jeqo-Oryx-Pro,9092,ListenerName(PLAINTEXT),PLAINTEXT) (kafka.utils.ZkUtils)
...
[2017-09-27 22:09:33,817] INFO [Kafka Server 0], started (kafka.server.KafkaServer)
...
Run Applications
Start Producer Side
To get started, let’s start the producer side and test it.
Build the whole project: ./mvnw clean install
And start the producer application:
cd hello-world-producer/
java -jar target/hello-world-producer.jar server config.yml
This will start a web server listening on port 8080.
We have a resource listening on context /hello and an operation
GET /hello/{name} that will call the KafkaHelloWorldProducer
that sends the record to Kafka.
Once the applications is started, we can call the operation with curl:
curl -XGET http://localhost:8080/hello/jeqo
done.
Start Consumer Side
Once producer side is started and running, we can start consumer side to print out the events:
java -jar target/hello-world-consumer.jar server config.yml
...
Hi jeqo
...
So far these are common Kafka producer/consumer applications.
Source code on branch: steps/step-01
OpenTracing Instrumentation
OpenTracing has enrich its integration throw projects that we can contribute: https://github.com/opentracing-contrib/
We will follow the next steps:
-
Instrument Dropwizard
-
Instrument Kafka Producer
-
Instrument Kafka Consumer
-
Test complete Traces
Instrument Dropwizard
We are following this step to have a complete view since request is received.
Firsts let’s add Maven dependencies:
        <dependency>
            <groupId>io.opentracing</groupId>
            <artifactId>opentracing-api</artifactId>
            <version>0.30.0</version>
        </dependency>
        <dependency>
            <groupId>io.opentracing.contrib.dropwizard</groupId>
            <artifactId>dropwizard-opentracing</artifactId>
            <version>0.2.2</version>
        </dependency>
        <dependency>
            <groupId>com.uber.jaeger</groupId>
            <artifactId>jaeger-core</artifactId>
        </dependency>
First, the opentracing-api dependency.
Then dropwizard-opentracing that is the instrumentation for
DropWizard applications
that handles traces for all of your JAX-RS resource’s operations by default.
And jaeger-core that implements OpenTracing API and
adds the Jaeger Java Client to connect to Jaeger Agent.
Then, we need to instantiate and register the Tracer on the Application class:
    final Tracer tracer = //(1)
        new com.uber.jaeger.Configuration(
            getName(),
            new com.uber.jaeger.Configuration.SamplerConfiguration("const", 1),
            new com.uber.jaeger.Configuration.ReporterConfiguration(
                true,  // logSpans
                "localhost",
                6831,
                1000,   // flush interval in milliseconds
                10000)  /*max buffered Spans*/)
            .getTracer();
    GlobalTracer.register(tracer); //(2)
    final DropWizardTracer dropWizardTracer = new DropWizardTracer(tracer); //(3)
    environment.jersey()
        .register(
            new ServerTracingFeature.Builder(dropWizardTracer)
                .withTraceAnnotations()
                .build());
In the first operation, we are instantiating a Tracer object with
Jaeger. Jaeger Agent should be running on port localhost:6831.
Then we are registering the tracer on the GlobalTracer helper, to
reference it from other layers.
And in the third step, we are integrating the tracer with DropWizard.
We are configuring this integration to only trace operations with
@Trace annotation: .withTraceAnnotations()
So, your resource class, should looks like this:
  @GET
  @Path("{name}")
  @Trace
  public Response sayHi(@PathParam("name") final String name) {
    producer.send(name);
    return Response.accepted("done.").build();
  }
Let’s install and start Jaeger, in its standalone version:
cd jaeger/
./install-jaeger.sh
And then:
./start-standalone.sh
Once it is started, you can go to: http://localhost:16686/search
And check its UI.
Now, let’s run a first request to check if a trace is created:
curl http://localhost:8080/hello/jorge
And refresh the Jaeger UI:
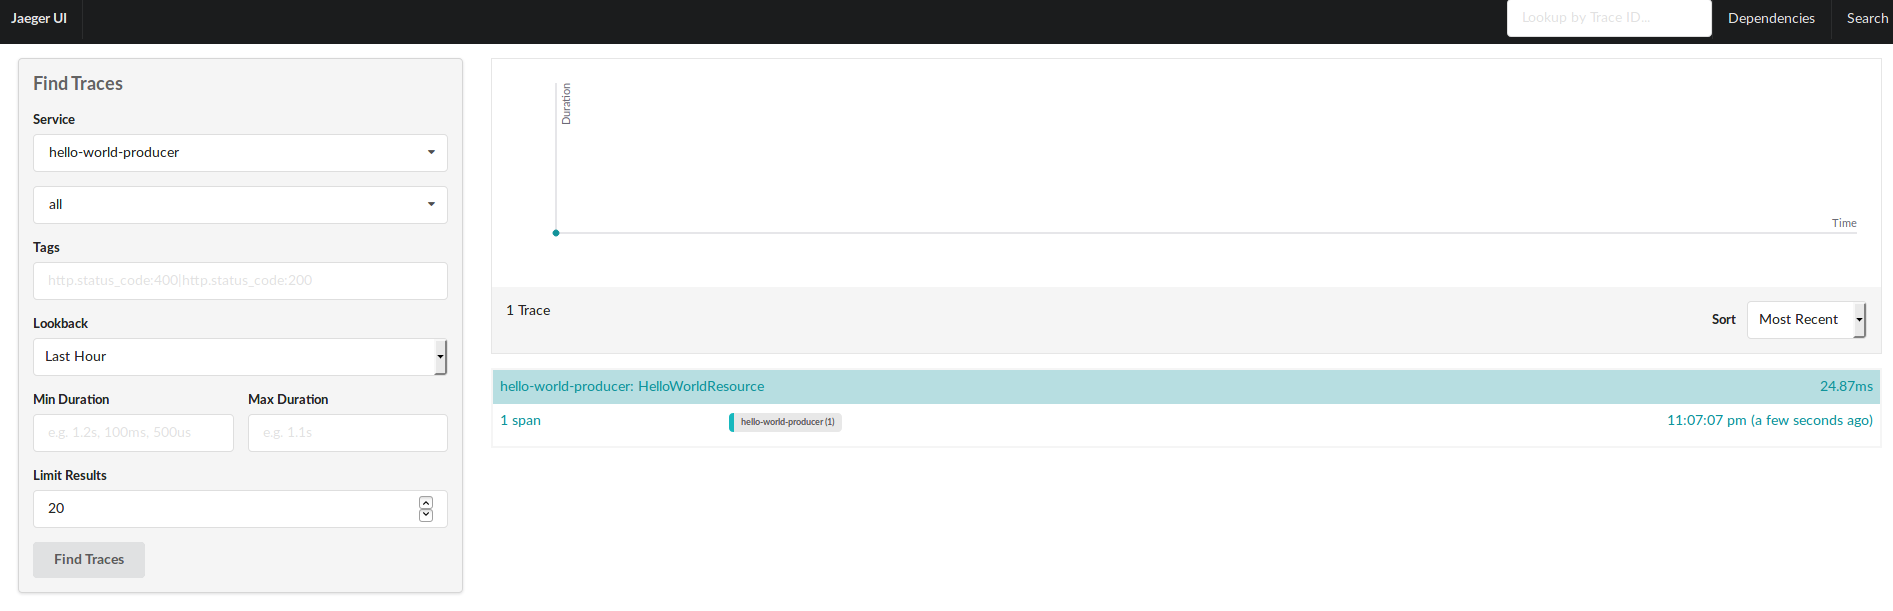
Source code on branch: steps/step-02
Instrument Kafka Producer API
Cool! Now we have how long it takes to return a response on the producer side :)
From here we can start asking:
How long it takes to execute the send operation by the Kafka
Producer? How long it takes to receive metadata from broker?
How long it takes to receive the record on the consumer side?
Did the consumer side receive the message?
This are the question we should be able to solve using OpenTracing.
Now let’s add instrumentation for Kafka Clients:
First, let’s add another dependency:
<dependency>
    <groupId>io.opentracing.contrib</groupId>
    <artifactId>opentracing-kafka-client</artifactId>
    <version>0.0.4</version>
</dependency>
https://github.com/opentracing-contrib/java-kafka-client
And let’s wrap the tracer on a TracingKafkaProducer:
    final KafkaProducer<String, String> kafkaProducer =
        new KafkaProducer<>(producerProperties, new StringSerializer(), new StringSerializer());
    final TracingKafkaProducer<String, String> tracingKafkaProducer =
        new TracingKafkaProducer<>(kafkaProducer, tracer);
The main difference, is that TracingKafkaProducer will inject
tracing context on Kafka Headers (supported since v0.11.0).
That’s it, let’s redeploy and test again.
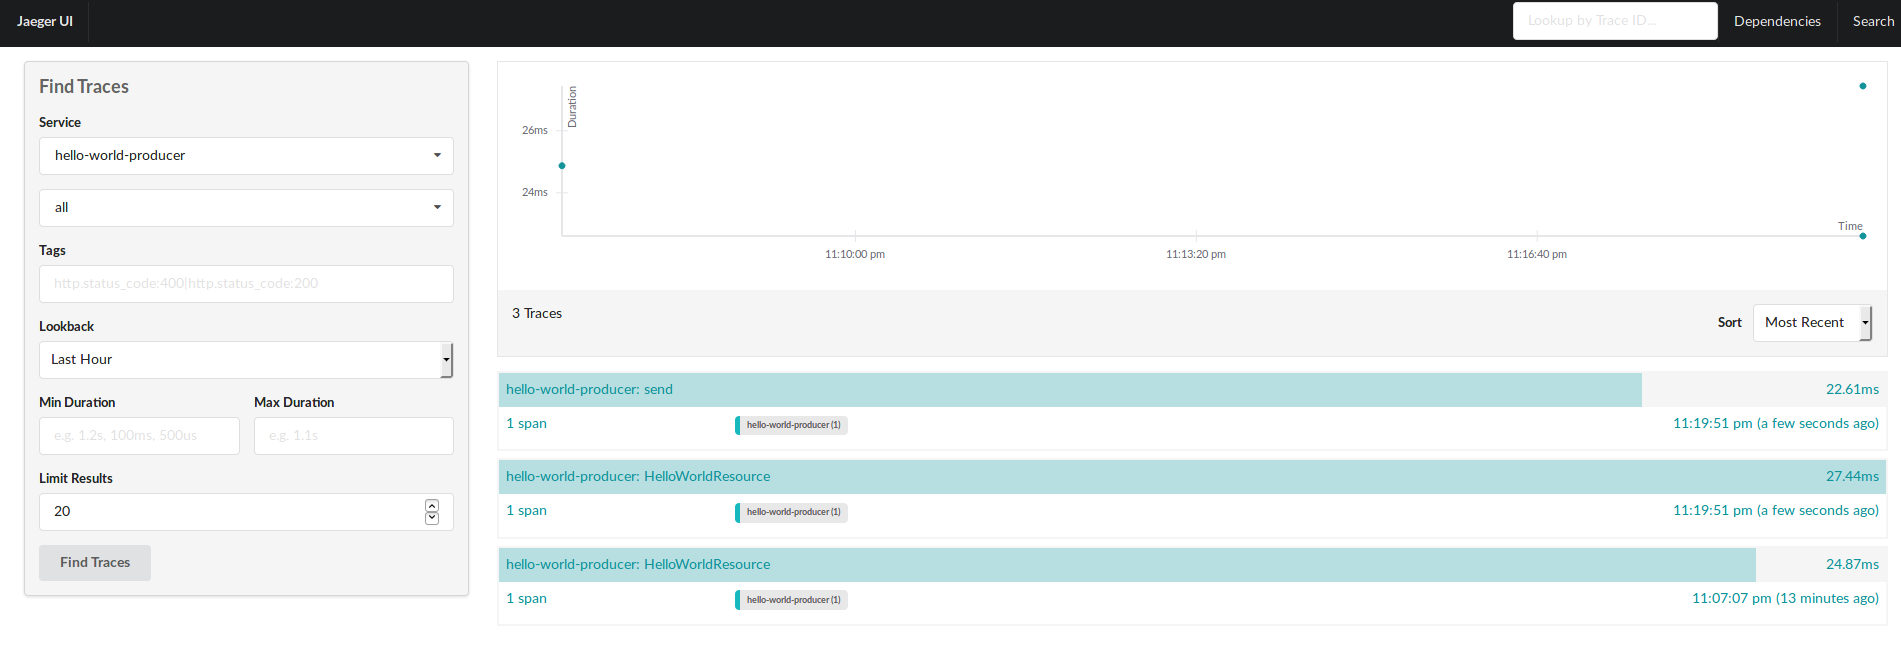
Wait!!! but we only run one request, why do we have 2 traces???
The thing is that to create spans that are related, we need to create
a reference.
How do we do this?
First, we need to obtain the span from the request, and then create an
ActiveSpan that will wrap the execution of Kafka Client. Let’s see
how this looks:
Let’s go to the resource operation and add a parameter:
  public Response sayHi(@Context final Request request,
                        @PathParam("name") final String name) {
Then we can use it to get the span using the DropwizardTracer:
@Path("hello")
public class HelloWorldResource {
  private final DropWizardTracer dropWizardTracer; //(1)
  private final KafkaHelloWorldProducer producer;

  public HelloWorldResource(final DropWizardTracer dropWizardTracer,
                            final KafkaHelloWorldProducer producer) {
    this.dropWizardTracer = dropWizardTracer;
    this.producer = producer;
  }

  @GET
  @Path("{name}")
  @Trace
  public Response sayHi(@Context final Request request,  //(2)
                        @PathParam("name") final String name) {
    final Span span = dropWizardTracer.getSpan(request);  //(3)

    try (ActiveSpan activeSpan =
             dropWizardTracer.getTracer()
                 .buildSpan("sayHi")
                 .asChildOf(span)
                 .startActive()) {  //(4)
      producer.send(name);
      return Response.accepted("done.").build();
    }
  }
}
First we inject the Tracer, then we get the span from Request, and finally we create an ActiveSpan that wraps the producer.
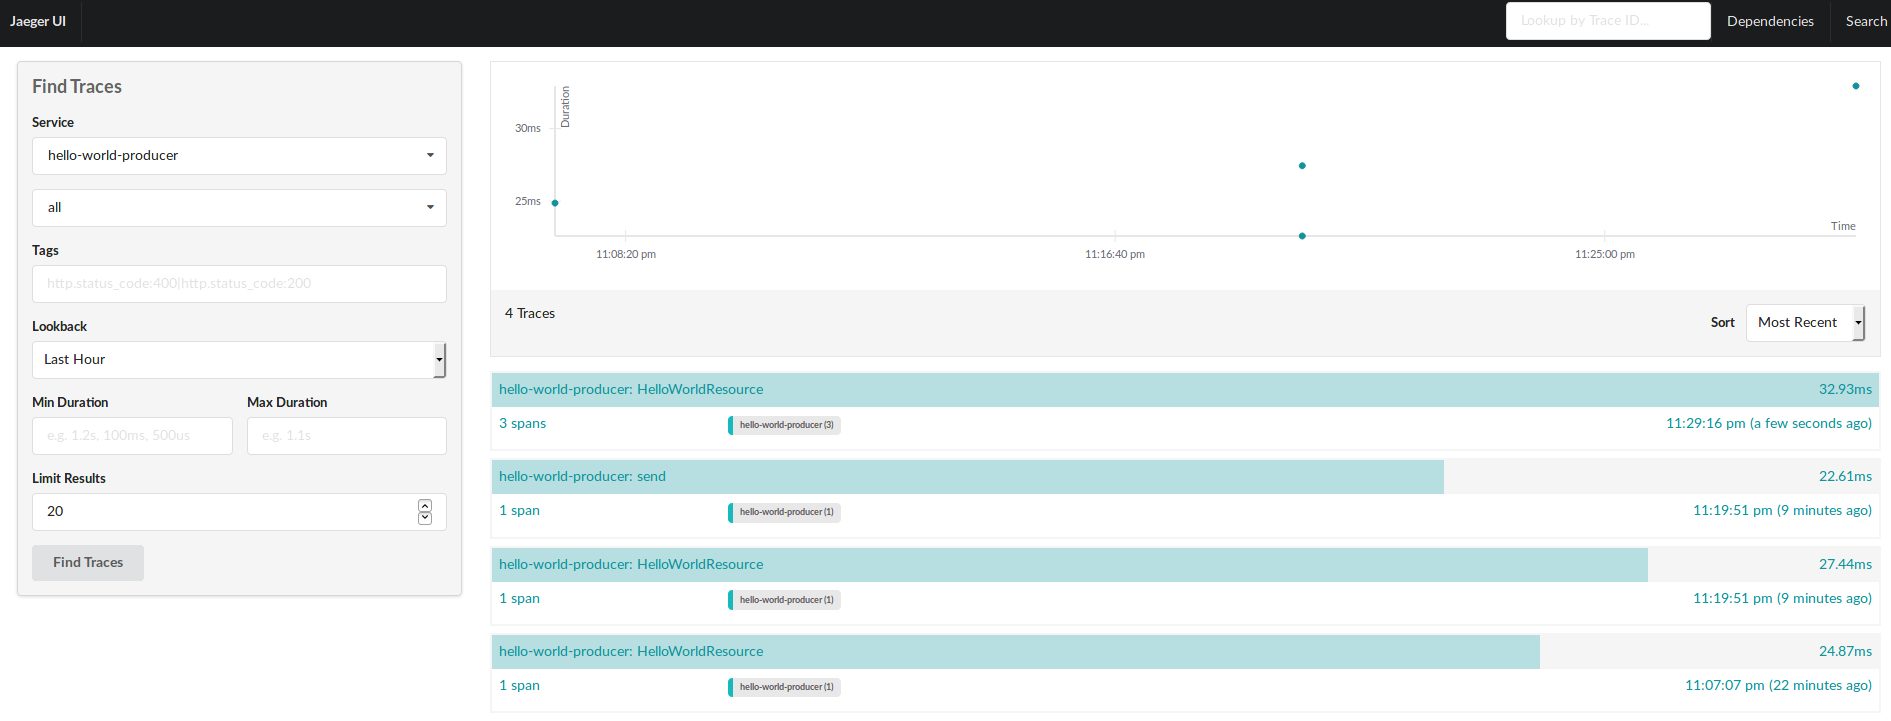
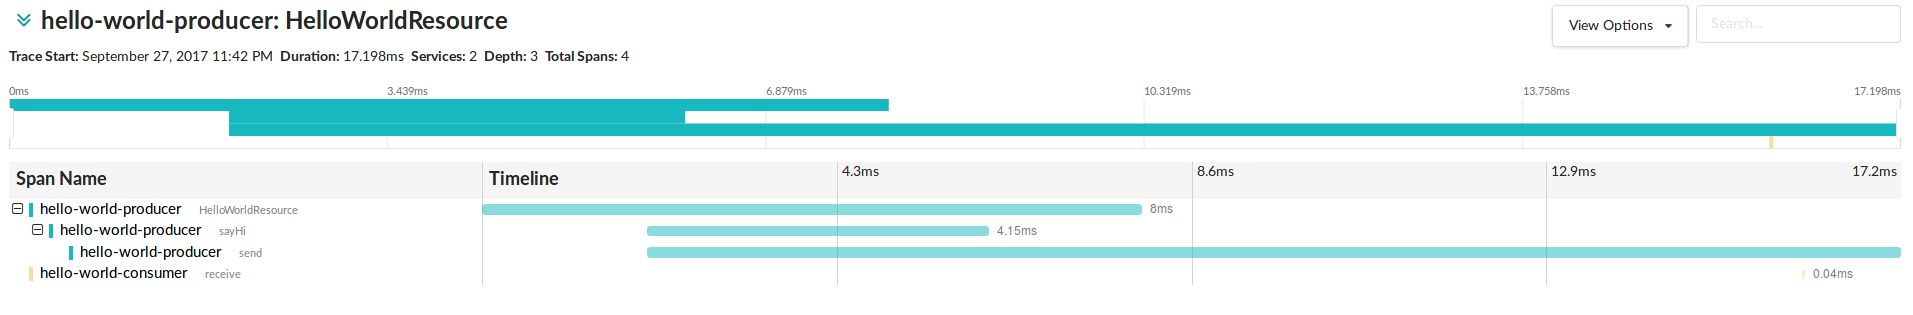
And if we go to the detail we can get more insight from the execution:
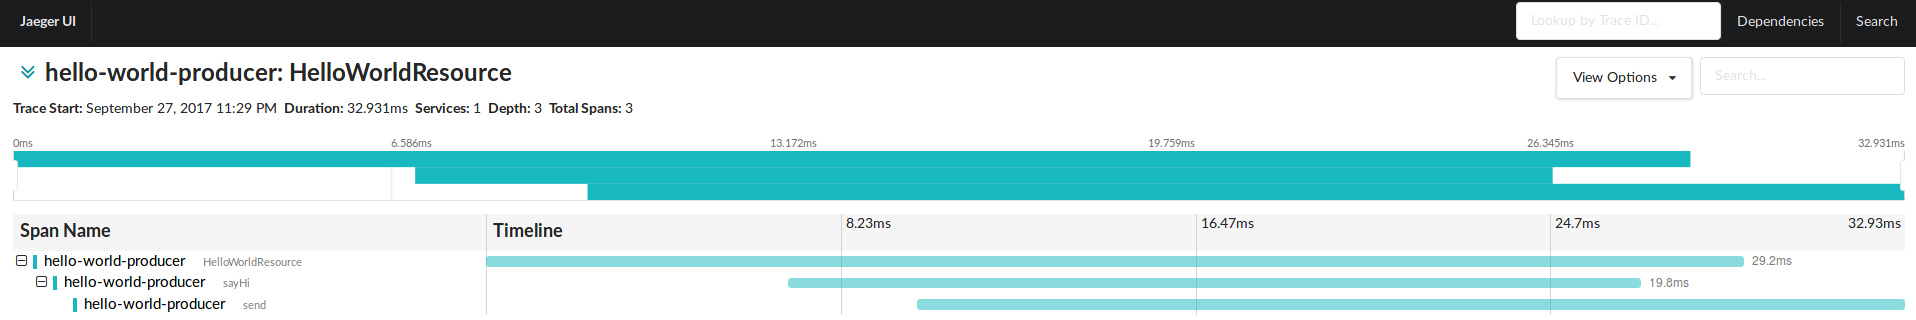
We can get a more deep understanding about the trace execution, how the callback works on the producer side, processing the metadata asynchronously, and so on.
Instrument Kafka Consumer API
Ok, so far so good. We have a complete visibility over the execution on the producer side. But what happen next? How the consumer side reacts?
To know that using OpenTracing instrumentation we will using the same integration of OpenTracing with Kafka, but it is a bit different.
Again, let’s start adding dependencies:
        <dependency>
            <groupId>io.opentracing</groupId>
            <artifactId>opentracing-api</artifactId>
            <version>0.30.0</version>
        </dependency>
        <dependency>
            <groupId>com.uber.jaeger</groupId>
            <artifactId>jaeger-core</artifactId>
            <version>0.20.6</version>
        </dependency>
        <dependency>
            <groupId>io.opentracing.contrib</groupId>
            <artifactId>opentracing-kafka-client</artifactId>
            <version>0.0.4</version>
        </dependency>
opentracing-api and jaeger-core for instrumentation and opentracing-kafka-client
for integration with Kafka Clients.
Then, we need to instantiate the Tracer, but without the DropwizardTracer
given that we don’t need to trace HTTP endpoints:
    //Instantiate and register Tracer
    final Tracer tracer =
        new com.uber.jaeger.Configuration(
            getName(),
            new com.uber.jaeger.Configuration.SamplerConfiguration("const", 1),
            new com.uber.jaeger.Configuration.ReporterConfiguration(
                true,  // logSpans
                "localhost",
                6831,
                1000,   // flush interval in milliseconds
                10000)  /*max buffered Spans*/)
            .getTracer();
    GlobalTracer.register(tracer);
And then, instantiate the TracingKafkaConsumer:
    final TracingKafkaConsumer<String, String> tracingKafkaConsumer =
        new TracingKafkaConsumer<>(kafkaConsumer, tracer);

    //Define Runnable Handler
    final KafkaGreetingsHandler greetingsHandler =
        new KafkaGreetingsHandler(tracingKafkaConsumer)
Should be enough. Let’s try it out:
(build and run your consumer side)
./mvnw clean install
 java -jar target/hello-world-consumer.jar server config.yml
curl http://localhost:8080/hello/jorge
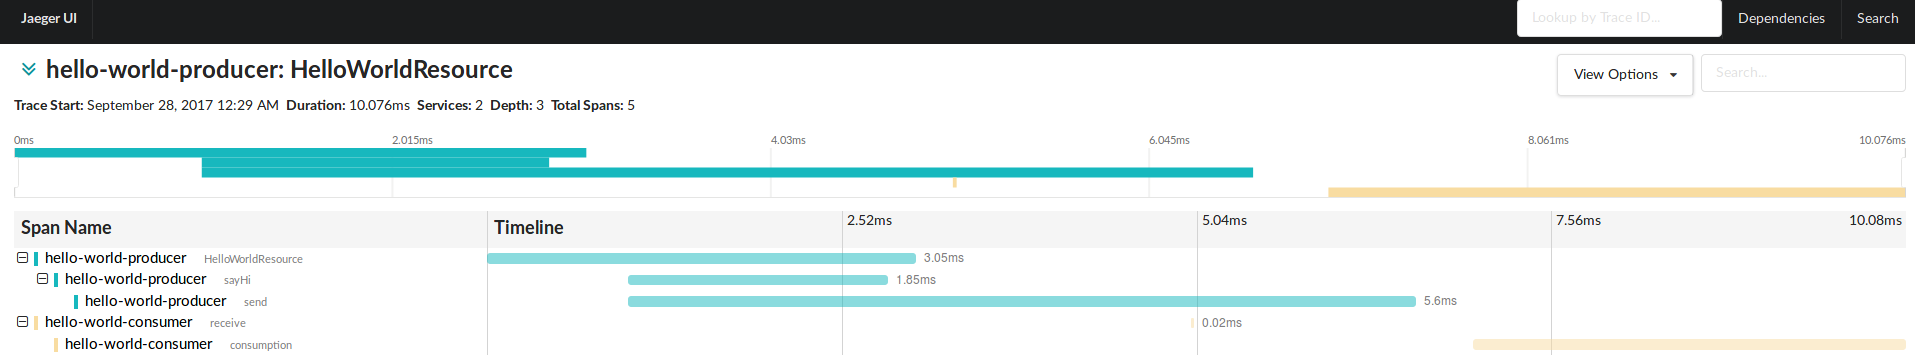
That’s great! Now we have how long it takes to receive a record on the consumer side.
But, what if we want to measure the complete execution, since we get the message until we commit it?
To do this, we can add an ActiveSpan on the consumption side:
        for (ConsumerRecord<String, String> consumerRecord : consumerRecords) {
          try (ActiveSpan activeSpan =
                   GlobalTracer.get()
                       .buildSpan("consumption")
                       //.asChildOf(context)
                       .startActive()) {
            System.out.println(consumerRecord.value());

            kafkaConsumer.commitSync();
          }
        }
But where is the context coming from?
Well, as TracingKafkaProducer inject tracing contexts on Headers,
we can use TracingKafkaUtils to extract it, and reference it:
        for (ConsumerRecord<String, String> consumerRecord : consumerRecords) {
          final SpanContext context =
              TracingKafkaUtils.extractSpanContext(consumerRecord.headers(), tracer);
          try (ActiveSpan activeSpan =
                   tracer.buildSpan("consumption")
                       .asChildOf(context)
                       .startActive()) {
            System.out.println(consumerRecord.value());

            kafkaConsumer.commitSync();
          }
        }
Source code on branch: steps/step-03
Recommendations
Trace Tags
One important feature of OpenTracing API is supporting tags. These
help to reference metadata that enables reference to business data
that can be use to map your trace with a transaction.
Also don’t try to overuse tags and use something like the Elastic Stack
or Splunk to store your logging messages, and use tags just to reference
the transaction ID, the entity ID or user ID.
For instance, in this case, we can add a tag to track the name:
On the producer side:
    try (ActiveSpan ignored =
             dropWizardTracer.getTracer()
                 .buildSpan("sayHi")
                 .asChildOf(span)
                 .withTag("user", name)
                 .startActive()) {
      producer.send(name);
      return Response.accepted("done.").build();
    }
And in the consumer side, the same story:
          try (ActiveSpan ignored =
                   tracer.buildSpan("consumption")
                       .withTag("user", consumerRecord.key())
                       .asChildOf(context)
                       .startActive()) {
            System.out.println(consumerRecord.value());

            kafkaConsumer.commitSync();
          }
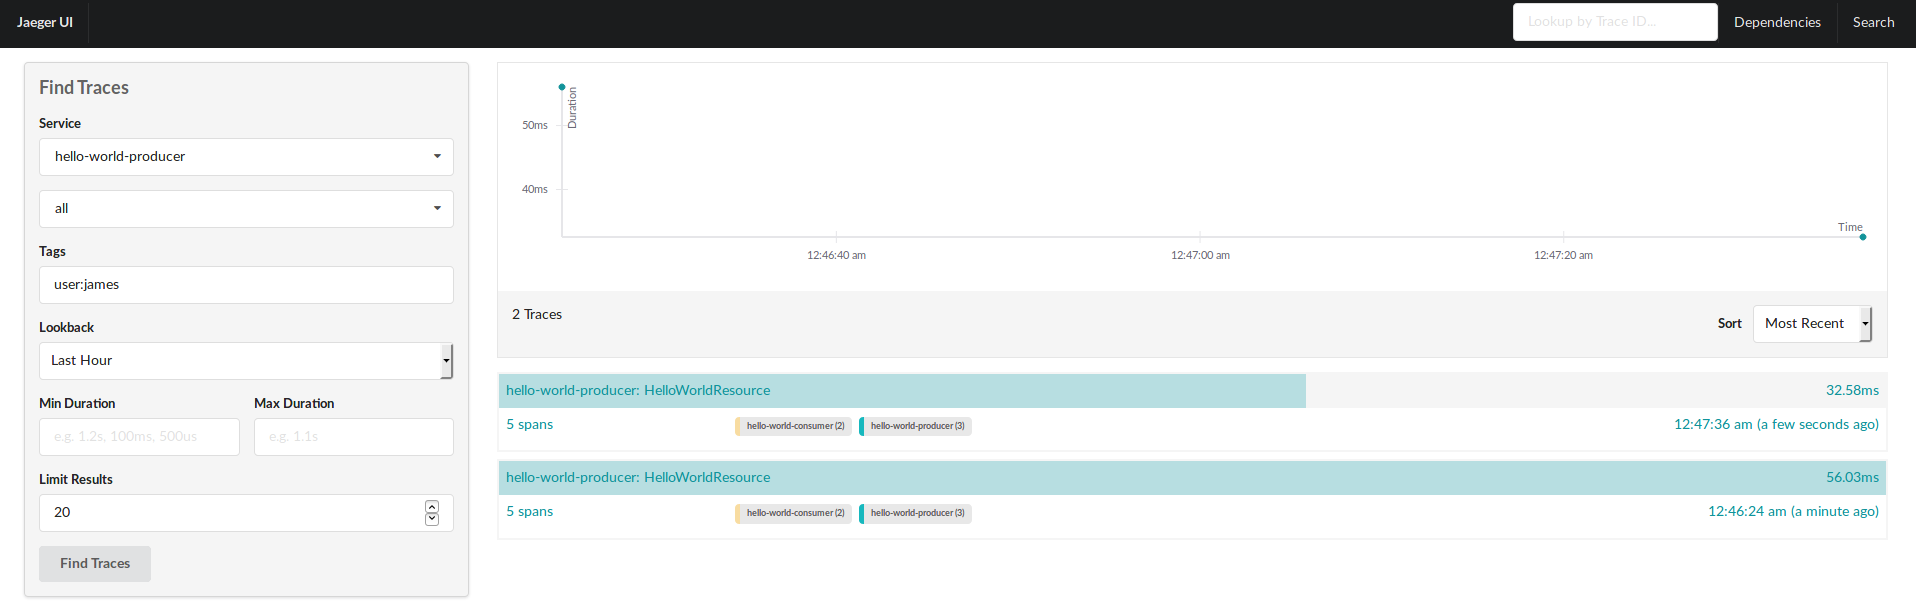
And you can filter now from the UI:
Dropwizard Helpers
I have developed some Dropwizard modules to help to instantiate Kafka Clients, create Topics, instantiate Traces, and so on. I’m working on Documentation but you can find it on Maven Central already:
https://github.com/jeqo/dropwizard-modules/
https://mvnrepository.com/artifact/io.github.jeqo.dropwizard